Fri, August 31st, 2018 (begun this article)
Wednesday September 19, 2018 (I finally finished it!)
MODOKI EL NINO = bad, REGULAR EL NINO = not as bad, WEAK EL NINO to ENSO Neutral = possibly good! There are many possibilities with the last one (the one we think is coming) but we will nail it down for you!
WA/ ID/ MT, and Inland Empire (Spokane-Coeur d'Alene)
FALL and WINTER SEASON FORECAST FROM SNOWFORECAST.COM!
...WHAT IS THE FORECAST?...
OCTOBER - (Above average snowfall and below average temperatures) Early season cold and October snows for the ski resorts, though best snow and coldest temperatures will be to the east of the divide and Wyoming/ southwest Montana. There will be enough cold to test out any snowmaking equipment, and the early snows will linger for some hours and even days to help cool the soil for some good base building when we move into November...
NOVEMBER - (Above average snowfall and near to below average temperatures) Continued good early season snow and lower than usual snow levels with early first measurable snows in the Inland Empire of Spokane-CDA, likely in early November. We expect some Thanksgiving opening days...
DECEMBER - (Near to above average snowfall and near to below average temperatures through mid December, then dropping off to below average snowfall and near average temperatures) Good snowfall events through mid December and near to below average temperatures, then incoming storms start shifting to the south on a different storm track, with lighter snows across the region as we move into the holidays.
JANUARY ONWARD, MORE COMING SOON - ? Stay tuned, but a brief synopsis: Dry for most of January with above average temperatures. Storms return in February with near to a bit below average snowfall (could still be good), then March through the rest of the season looks near to warmer than average in temperature, with below average snows, though April could produce some big storms and powder days to pass through the region, building the late season snowpack. More details are coming, and I will be naming resorts and forecasting long range snow totals.
CM
...WHAT ARE THE FACTORS AND OPINIONS?...
Here are my August 31 observations: An El Nino that "wants" to happen, but meager warming to even some cooling in the key Nino regions (recent), and a mostly neutral status (currently) is not showing much hope for any El Nino pattern that may be classified as moderate or strong. In fact, I will say that we will not see a moderate or strong El Nino SST pattern this 2018-2019 season, and the NOAA forecasted weak El Nino is looking like a "maybe".
And, my September 15 observations: Latest guidance indicates that the El Nino SST anomaly will be weak, at best, in my opinion. Here is why: Cooler eastern Pacific waters (Nino 3.4 region)/ Subsurface waters heat content (180-100W Lat) has decreased/ and the current pattern is showing mostly a general cooling and not warming overall, though in the last 7 days, eastern Pacific surface waters off the coast of Ecuador (means "Equator") have warmed . Its mid September and this El Nino event should be a bit more evident. Its not. Even NOAA has backed off a bit with a 65% chance of El Nino formation, instead of the 70% they had called for early on in the summer when this anomaly looked more likely. For them to back off a bit like that indicates definite lost confidence, and this is not surprising, as I lost confidence in it occurring myself, back in July. Things work a bit slower in these large organizations, while us "loose cannons" (whatever in the hell that means) can blast off at will. Haha.
 *An El Nino is still favored according to the above Climate Prediction Center chart*
 *We have seen some areas of cooling in the Nino 1+2 and 3 regions, as this El Nino struggles to form. This is indicating cooling in the subsurface waters, which is a factor that is looked at for potential SST's*

*As of Sep 12, there is some warming going on again in the referenced "Nino 3" region, so overall there is a positive SST anomaly, but mostly less than +.5 (in yellow on the above chart), which is the threshold that needs to be met for 3 consecutive months before an actual El Nino pattern is recognized. For now we are in an "ENSO neutral" status.
SOLAR MINIMUM: In terms of sunspot activity, there is currently almost none, or even "none", zero, zilch, nada, many days. Decreased or zero sunspot activity also affects our weather patterns. The chart below shows how we are in a solar "grand minimum" right now:

Side note, look at the last minimum, in 07-08-09', when the Inland Northwest had the most snow EVER recorded, back to back years, one with 170+ inches of snow in Coeur d'Alene, ID.
Also, we have seen some recent serious weather extremes this Summer of 2018, and have no reason to believe that we will not see similar extremes this fall and winter in North America:
From extreme heat in Europe, notably northern Europe:
 To extreme snow and cold in August
:

NOAA: So to reiterate, NOAA (the National Oceanic and Atmospheric Administration) was forecasting a 60% likelihood for formation of an El Nino SST pattern this fall, and a 70% chance for the winter, 2018-2019, while now those forecasts are down to 50-55% and 65-70%, respectively. Large organizations like NOAA are not going to go backward on the forecast (decreased % chance), like this without very good reason, like, "its not happening like we thought it would guys"...
SNOWFORECAST.COM: At this point, a "weak" El Nino SST anomaly is the forecast from NOAA. I have believed since June that this would be a weak El Nino pattern that sets up, based on the afore-mentioned trend, but am now wondering if this El Nino will even show up at all. For those who desire to see some at least average rain and snowfall this winter, a weak El Nino or no El Nino may be best. If an El Nino, weak, does form, it is looking more likely to be the Modoki version, which on average, sucks (dry) all across the western US. Thankfully, as a weak factor (there are other factors), a weak El Nino of any kind will have a "weaker" influence on the weather patterns we see this fall and winter, THANKFULLY. We are also looking (currently) at a weakly negative PDO (Pacific Decadal Oscillation, more of a long term state of ocean water temps), which will not help in the El Nino department. Neutral to "very weak El Nino" is what we are forecasting as we move into fall and maybe through the winter, at best +.5 which is barely classified as an El Nino. As well, with the Grand Solar Minimum, expect the unexpected, and so far, that has proven true in many parts of the world.
How will all of these factors; Weak El Nino, or even "ENSO Neutral" SST anomaly, neutral PDO, GSM (solar), and my own intuition, affect the Northwest US and Western Canada forecast? Just scroll back to the top to find out!
Feel free to share this, but please cite credit to snowforecast.com. Thank you! CM
Snowforecast.com Copyright © 1998–2018. Unauthorized Use Prohibited.
Some References:
COLD AND SNOW: https://www.theweek.info/index.php?newsid=3760 (Salzburg, over 1 foot of snow in August!)
HEAT: https://www.washingtonpost.com/news/capital-weather-gang/wp/2018/07/17/scorching-scandinavia-record-breaking-heat-hits-norway-finland-and-sweden (90+ degrees in Norway, all time record high temps!)
Great resource for current SST’s and anomalies:
https://www.tropicaltidbits.com/analysis/ocean/
International Research Institute:
https://iri.columbia.edu/our-expertise/climate/forecasts/enso/current/?enso_tab=enso-cpc_plume
Latest ENSO Discussion:
http://www.cpc.ncep.noaa.gov/products/analysis_monitoring/enso_advisory/ensodisc.php
Space Weather ("Solar Minimum"):
https://www.swpc.noaa.gov/products/solar-cycle-progression
NCEP model forecast SST anomalies (1 model forecasting La Nina):
http://www.cpc.ncep.noaa.gov/products/NMME/current/tmpsfc_Seas2.html
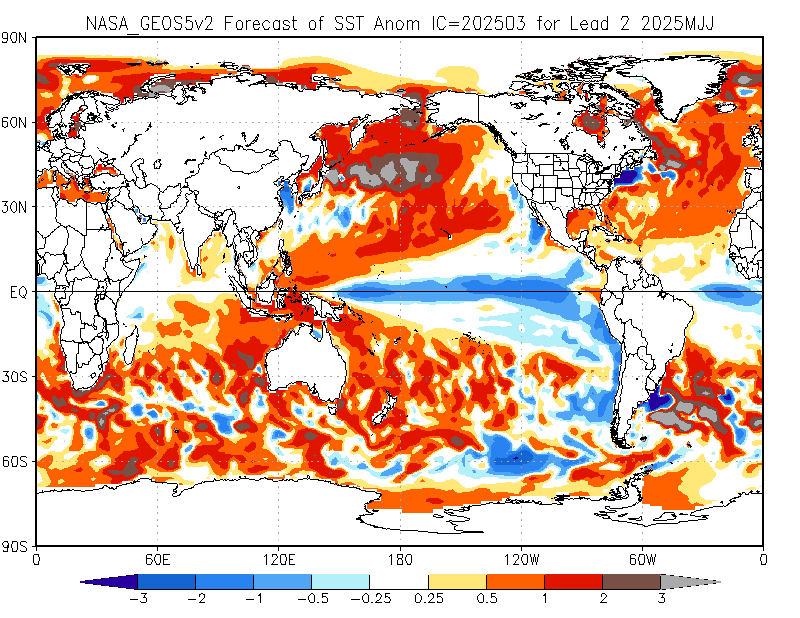
The ONE outlier model forecasting La Nina:
http://www.cpc.ncep.noaa.gov/products/NMME/current/images/NASA_GEOS5v2_ensemble_tmpsfc_season2.png
Loads of the latest SST charts from ESRL, knock yourself out:
https://www.esrl.noaa.gov/psd/map/clim/sst.shtml
Best anomaly chart (in my opinion):
https://www.esrl.noaa.gov/psd/map/images/sst/sst.anom.hov.gif
Detailed ENSO Discussion from NOAA:
http://www.cpc.ncep.noaa.gov/products/analysis_monitoring/lanina/enso_evolution-status-fcsts-web.pdf
More info/ charts on Modoki El Nino:
http://www.jamstec.go.jp/frcgc/research/d1/iod/enmodoki_home_s.html.en
El Nino/ La Nina years/ ONI:
http://ggweather.com/enso/oni.htm
A GREAT resource for "no BS" historical ski season info:
http://bestsnow.net/
Latest PDO and history:
http://research.jisao.washington.edu/pdo/PDO.latest.txt


 42°
35°
42°
35°
 35°
19°
35°
19°
 26°
18°
26°
18°
 88°
61°
88°
61°


